Regional Industry Insights brings together ESG data and sustainability intelligence from the ground up. The goal is simple yet powerful; to translate company-level progress into regional and national insights that guide smarter, more sustainable growth.
Starting at the micro level, we assess individual companies, including SMEs, through ESG maturity evaluations, materiality mapping, and performance benchmarking. These granular findings are then aggregated into meso-level insights that highlight industry patterns, transition pathways, and regional opportunities.
At the macro level, this unified data ecosystem enables policymakers, investors, and business leaders to identify systemic strengths and gaps across value chains, fostering a more resilient and transparent sustainability landscape.
By connecting ESG maturity with economic indicators, the platform supports evidence-based decision-making, helping regions, industries, and enterprises progress together toward a regenerative, low-carbon future.
The Circular design, clean energy, and resilient value chains - the EU’s transition toward sustainable competitiveness.
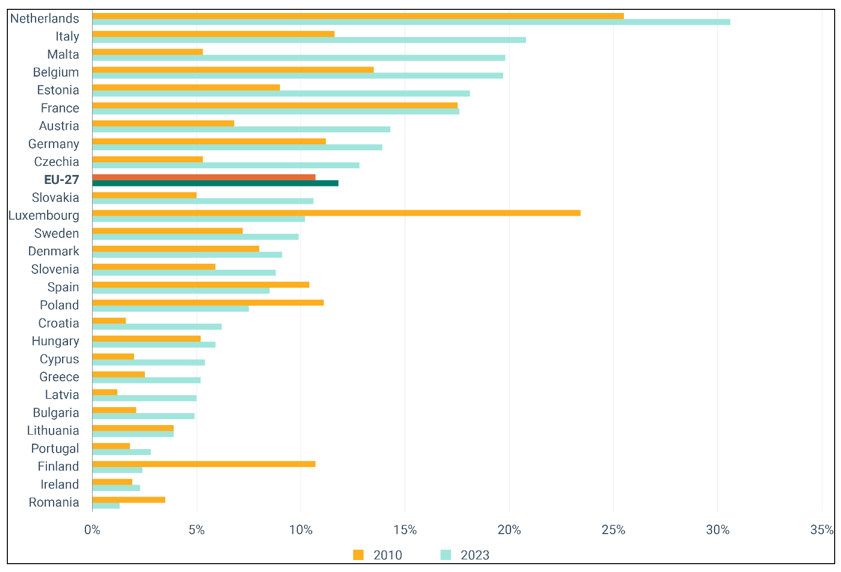
Circular material use (EU-27, 2023)
Targeted increase under EU Action Plan (CMUR)
Hydrogen infrastructure required by 2030
EU-fleet-wide CO₂ emission target, 2035 onwards
The Circular Material Use Rate (CMUR) quantifies the proportion of all materials consumed in the EU that come from recycled waste. It provides an essential measure of progress toward a regenerative economy. As demand rises across industries, keeping materials in play for longer and minimizing waste becomes increasingly urgent.
The Netherlands leads with 30.6% circularity (2023). These differences stem from variations in infrastructure, industrial focus, and policy. Both the Netherlands and Italy recycle over one-fifth of their total material use - evidence that rapid transition is achievable with proactive policies and innovation.
Source: European Environment Agency (EEA, 2024)
Despite progress, Europe’s circularity remains low, with most consumption relying on virgin materials. To double the CMUR to 24% by 2030, the EU must accelerate reforms, enhance infrastructure, and strengthen market incentives. High-performing nations offer a blueprint for scalable success.
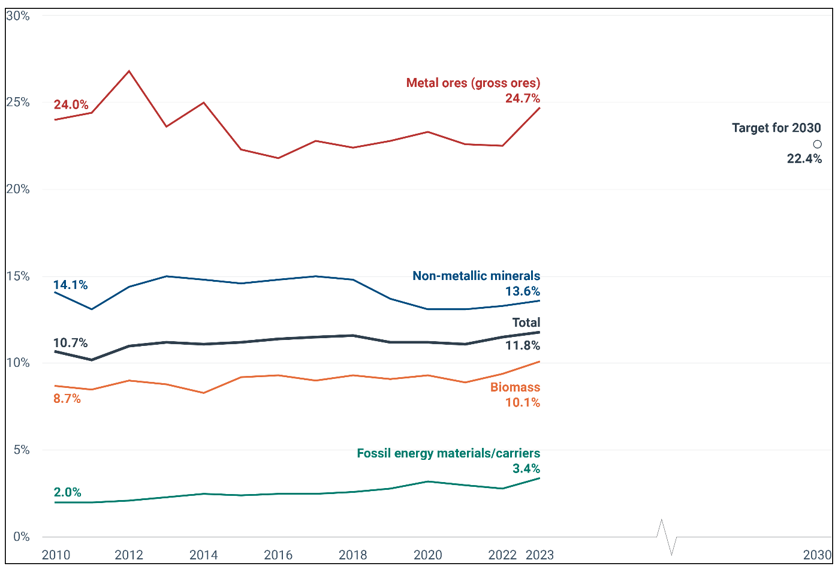
Improvement in EU resource productivity (2010-2023)
Part of products’ environmental impacts are determined at design phase
Projected by 2030 in recycling, remanufacturing, and repair
Climate neutrality by 2050, and building a more resilient and competitive Europe.
EU SET Plan: energy use reduction in buildings by 2030 (vs 2020)
Of biodiversity loss is caused by resource extraction & processing
From waste-to-wealth, innovation, and green jobs - India’s journey toward sustainable growth and resilient value chains.
Projected circular economic value by 2050 [PIB]
Green jobs creation by 2050 [PIB]
Resource efficiency improvement targeted by 2030
Reduction in water consumption by 2050
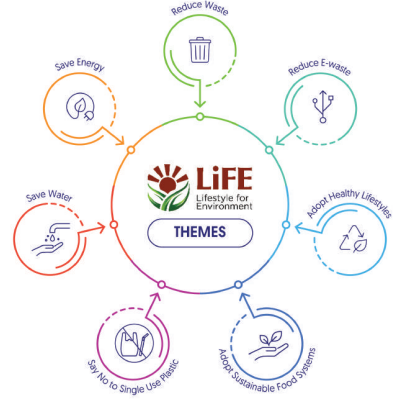
India’s circular economy transition is reshaping its development narrative. Anchored in Mission LiFE, Swachh Bharat, and the National Resource Efficiency Policy (NREP), the country is integrating circular design, green entrepreneurship, and extended producer responsibility (EPR) into its industrial fabric.
To achieve the aforementioned targets, India is working strategically towards increasing its renewable energy capacity, increasing the uptake of electric vehicles (EVs), investing in green fuels, introducing resource and material efficiency policy into industry, scaling up effective sanitation and waste management systems. We have to dematerialise for a sustainable Circular Economy.
Increase in India’s recycling capacity (2019–2025)
Product lifecycle emissions determined at design phase
New jobs in circular manufacturing and recycling sectors
Aligned with India’s Net Zero 2070 and LiFE frameworks
Power mix from renewables by 2030
Current municipal solid waste recycled - potential to grow

